Navigating the ‘My Reports’ Dashboard in the Customer Portal
The ‘My Reports’ Dashboard gives customers a centralized, real-time view of their support ecosystem — including cases, surveys, service metrics, availability, and change requests.
This guide explains how to access the dashboard, navigate between its sections, apply filters, and interpret the reports available across the five tabs.
1. Accessing the ‘My Reports’ Dashboard
To open the dashboard:
- Log in to the Customer Portal.
- From the left navigation menu, select My Reports
. - The dashboard will launch with the Support Cases tab selected by default
2. Understanding the Dashboard Layout:
Once inside the ‘My Reports’ dashboard, you will see:
A. Top Navigation Tab:
These tabs separate the reports into four functional groups:
B. Filters on each tab:
Appears at the top left based on your layout. Filters change dynamically depending on the selected tab.
C. Reports in each tab:
Visual summaries, bar charts, line charts, and list views.
D. Drilldown / List View:
Clicking any segment in a report opens a list view of the cases behind it.
Example: Clicking High in Active Cases by Priority shows all active high-priority cases for that customer.
3. Tab-by-Tab breakdown
|
Tab / Report Group |
Description / Insights Provided |
|
Support Cases |
Displays all customer support cases raised by respective customer account, including their current status (Open, In Progress, Resolved, Closed). |
|
Support Surveys |
Shows results of post-resolution customer satisfaction surveys and overall support satisfaction score. |
|
Case Metrics |
Summarizes KPIs related to response and resolution times. Helps track overall support efficiency. |
|
Change Requests |
Lists all change requests, including approval status, progress, and closure details. |
Tab 1: Support Cases
Provides a real-time and historical overview of all support cases created by the customer.
Filters:
|
Filter Name |
Purpose |
|
Case Created Date |
Filter reports by case creation date. |
|
Resolved Date |
Filter reports by case resolution date. |
Reports
Active Cases per Priority: Shows active cases categorized by priority (High / Medium / Low).
Use Case: Helps customers assess urgency and ticket load.
Active Cases per State: Breakdown by states such as Open, In Progress, Resolved, On hold or Closed.
Cases Created (Monthly Trend): Bar chart showing how many new cases were created each month.
Cases Resolved: Monthly trend of resolved cases.
All Active Tasks (List View): Detailed list of all open/active cases with columns like Priority, Assigned to, State, etc.
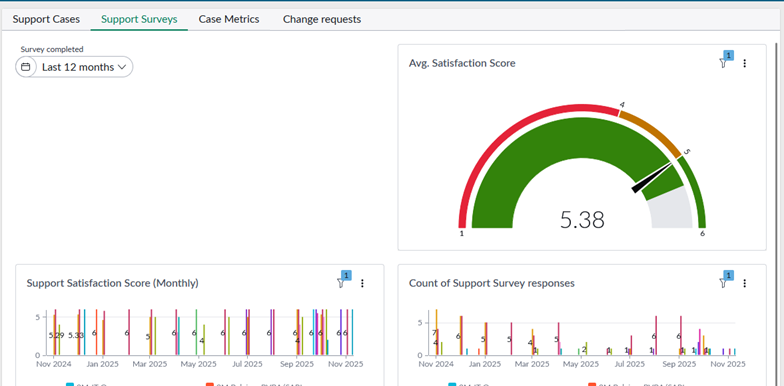
Tab 2: Support Surveys
Filters
|
Filter Name |
Purpose |
|
Survey Completion Date |
Filter reports by survey completion date. |
Reports:
Avg. Satisfaction Score: Shows the average satisfaction score (scale 1–6) for the selected date range.
Support Satisfaction Score (Monthly): Displays month-wise average CSAT scores for each account.
Count of Support Survey Responses: Shows the number of survey responses received per customer each month.
Support Survey Comments: Lists customer feedback comments along with related details.
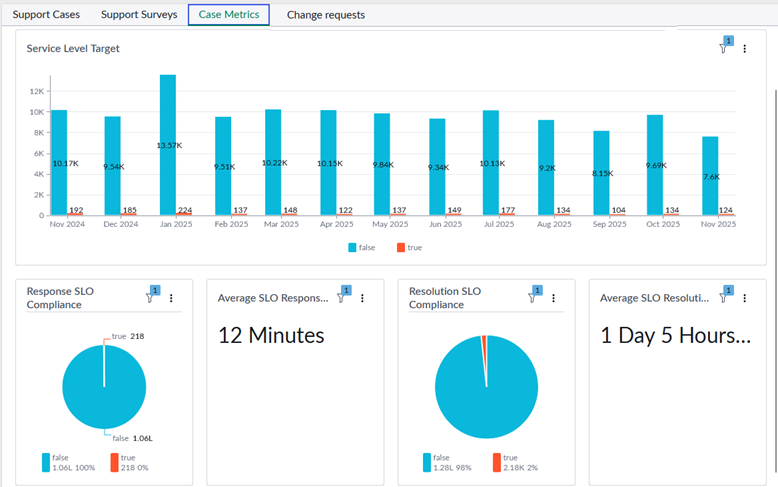
Tab 3: Case Metrics
Filters:
|
Filter Name |
Purpose |
|
Case Closed Date |
Filter reports by case closure date. |
Reports:
Service Level Target – Shows SLA target achievement (True/False).
Average SLO Response Time – Displays average response time for support cases.
Resolution SLO Compliance – Shows compliance rate for resolution SLOs.
Average SLO Resolution Time – Displays average resolution time for support cases.
Support Resolution Time – Provides case-wise SLA/SLO resolution time details.
Tab 4: Change Requests
Filters:
|
Filter Name |
Purpose |
|
Request Created |
Filter reports by request creation date. |
|
Request Closed Date |
Filter by request closure date. |
Reports:
Change Requests Created: Monthly trend of created change requests.
Open Change Requests (By Creation Month): Open requests grouped by the month they were created.
Open Change Requests: Complete list of currently open change requests.
Backlog: Shows all pending change requests.
Change Requests Closed: Monthly trend of closed change requests.